Klamath River Flood and Drought Data
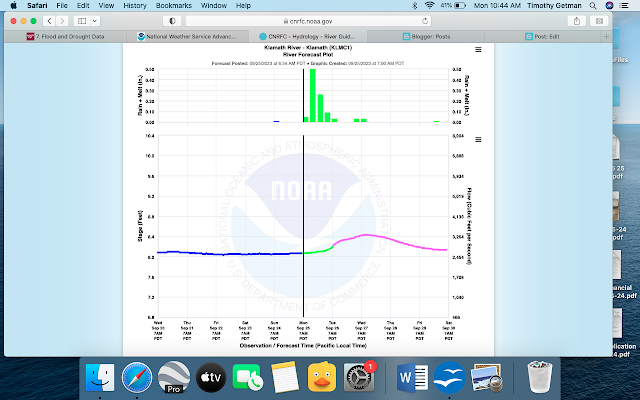
So, this was fun to look at the different present and historical data from the river. Coincidentally, there is A LOT of rain forecast for this week in the region, so I was interested to see what was going on on the Klamath. There actually is a flood watch but not for the river itself. Many streams and hillsides are covered in burn scars and debris from the recent fires in the area, so there is risk of tributary streams and creeks clogging and filling up but not the river itself. I looked at the the NWS link for Advanced Hydrologic Prediction https://water.weather.gov/ahps2/index.php?wfo=mfr and the California Nevada River Forecast Center (CNRC) https://www.cnrfc.noaa.gov/graphicalRVF.php?id=SEIC1. Both use NOAA data and are set up a little differently, but similarly show the present week and forecast (screenshot 1), historical flood or crest data (screenshot 2), and what kind of impacts different river levels would have on the area. I have so many screenshots below because the Klamath has 3 different gauges set up, the farthest downstream at Klamath town:
Next upriver is in the town of Orleans:
Finally there is data received from the gauge in Seiad Valley:
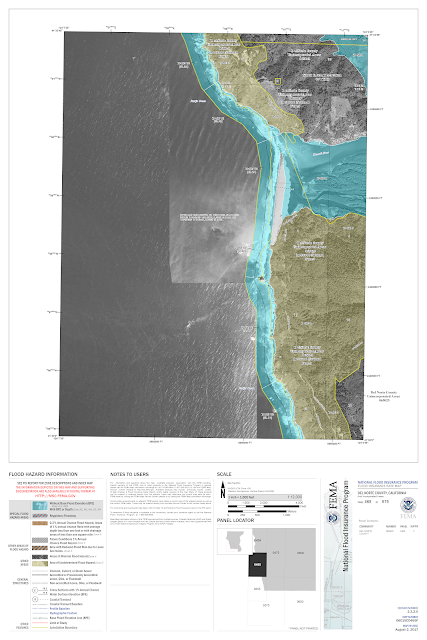
The final set of slides from the NWS site is visual data below the Iron Gate Dam, there is no gauge here:
It's a lot of slides to scroll through, so apologies. I just kind of nerded out on the different ways they were set up. The historical data I found easier to read on the CNFRC site, but the impact at certain feet is more flushed out on NWS. But as you can see, there is not much threat of cresting on the Klamath at any of these four points. But is interesting to note that the most floods happen in the winter and early spring, the former when there is the most rain, and the latter when snowmelt begins.
Most telling, viewing recent and historic crests and floods at all the data points, is how much lower the flow is now. There has still been flooding but not nearly at the height of historic levels. For example, in Orleans and Klamath where the highest levels happen generally, there was a big flood in 1965. But between 2018 and 2022, the highest crests have been 10-20 times below anything before.
This makes sense, in that the region has been in drought off and on, mostly on for many years. Climate change has certainly impacted this with hotter, drier summers, and lower rain fall and snowpack. Even with a somewhat wetter winter, the region is still struggling and on July 5, the U.S. Bureau of Reclamation issued what the agency refers to as a “Drought Plan” for the Klamath Project, which will require many farmers to stop irrigating before the end of the growing season.
Here https://www.drought.gov/states/oregon/county/klamath, you can see in Klamath County, while the precipitation is up, it hasn't relieved many folks from drought conditions:
I look forward to talking to my watershed organizations of choice to see how dam removal may help in drought conditions.


Comments
Post a Comment